
Data Science work flow for building data products
In this blog, we are going to learn about the overall data science work flow with a real world example. The process described below also conforms to the CRISP-DM framework. CRISP-DM framework is Cross Industry standard practices for Data mining as it describes the standard industry practice followed in data mining. This practice is also to relevant / applicable to predictive modelling. We describe CRISP-DM with real world world example of predicting the value of a resale car. The CRISP-DM usually
A simplest example that we deal with in our everyday life is that either we wish to resale our two wheeler or four wheeler. In this case you are reseller. If you think the other way, let us say you wish to buy a presold two-wheeler or four wheeler. The problems that we face as a buyer or seller, what is the right price of a resale car is?
In the last 5 years a lot of intermediaries or brokers have flourished in India who are helping the buyers and sellers get the right price for their purchase like https://www.cars24.com/, https://droom.in, www.cardekho.com/, and www.carwale.com/.
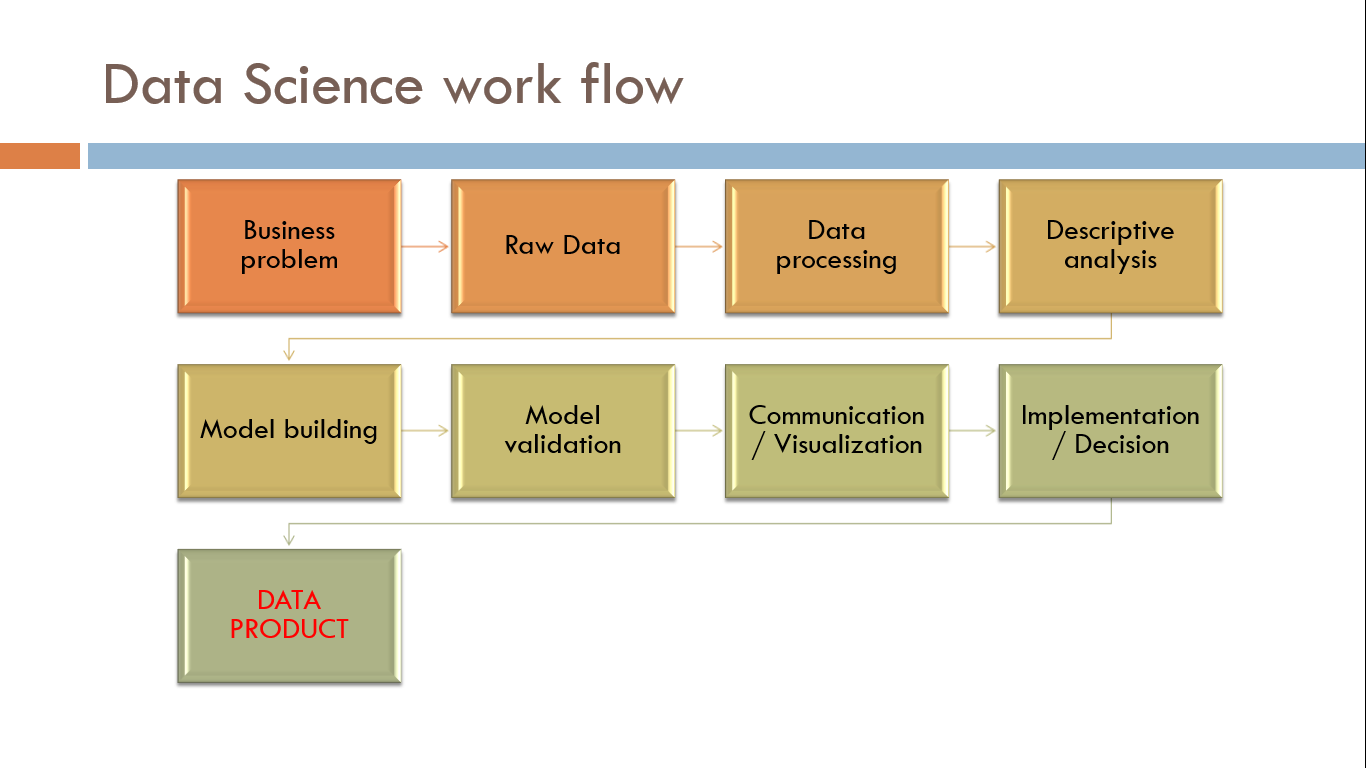
Figure: Data Science work flow for building data products
Stage 1: Business problem and opportunity identification
To simplify the process of determining, the price / value of the resale car, these portals have developed a machine learning model to predict the price of a resale car. Now, this is the business problem that we wish to predict the price of resale car. This is an opportunity to build data products Let us understand the process of finding the price of a resale car.
Visit the https://www.cars24.com/ website. Scroll down the page and click on the “Start car valuation” online. If you observe it will ask you to enter various details of your car like Brand, Model, year of manufacturing, variant, car registration state, Kilometers driven, your email id and mobile number. Please us go ahead and enter these details on the website. If you enter these details you will get the value of your car.
The question to ask is how cars24 is able to determine the value of your car. What goes behind in predicting the price of a used car?
The answer to this question is a machine learning model is built to predict the price of the car. In this case possibly linear regression algorithm is being used. To build such model one needs to identify the parameters which helps in predicting the price. The parameters which cars24 is using are Brand, Model, year of manufacturing, variant, car registration state, and Kilometers driven etc.
The next question to ask is how these models are built. This will help us understand the overall data science work flow. The steps that are followed in a data science work flow is identifying the business problem, acquisition of Raw Data, Data processing, Descriptive analysis, Model building, Model validation, Communication / Visualization of results, Implementation / Decision related to the model which results in a data product.
Any data science work flow, after understanding the business problem, starts with the acquisition of the raw data. What would be the source of data? Whether you need to purchase this data offline, collect the data online or look inside your database whether you have the right kind of data?
Stage 2: Data acquisition
The next step after acquisition of the data is, what are the factors contributing to the price of a resale car? Now you have started thinking like a data scientist. The pre-requisite for becoming data scientist is asking the right questions. Now since you have asked this question about factors contributing to the price of a resale car? The importance of the domain knowledge comes into the picture. Possibly go out and ask these questions to potential buyers and sellers, how do they arrive at a price of resale car? The answers will start flowing: Year of registration, vehicle type, Year of make, kms driven, make of the car, original value of the car, fuel type, mileage, so on so forth. This is one of the way your parameters might emerge. The parameters might emerge from your own experience and domain expertise. After the paratmeters have emerged, the next question to ask is from where you will get this data. There could be multiple sources of data transactional data, behavioral data etc. In case of resale car, this data would come from the buyers and sellers of the car. One can think of actually designing an application to capture this data.
Stage 3: Data cleaning and pre-processing
The next step after data acquisition is data cleaning and pre-processing. The application of your statistical knowledge starts here: Removing outliers, Treatment of Missing Data, Malicious Data, Erroneous Data, Irrelevant Data, Inconsistent Data, and Formatting etc.
Stage 4:Exploratory Data analysis
The next step is performing exploratory data analysis. The measures of aggregation in the data are means, median and mode. The measures of dispersion in the data are variance, standard deviation and range. The other aspects of exploratory data analysis would be frequency distribution and whether the data is normally distributed or not?. You would also find out the type of variables in the data i.e. continous variable and categorical variable. The distribution of the data of both the categorical and continous variable is important here. This distribution of the data can be found out visualizing the data using histogram for continous variables and barplot for categorical variables. The outliers can also detected using boxplot of continous variables.
Stage 4: Model building steps
After you are done with the exploratory data analysis, the model building process starts. What is the right algotrim to predict price? As a data scientist, you will face such kinds of questions on a continuous basis depending upon the business problems you are dealing with. In case of predicting price of resale car. The algorithm being used is linear regression.
Stage 5: Model validation and evaluation
The model built is to be tested to another “test” dataset to evaluate and check accuracy of the model.
Stage 6: Data visualization
This relationship has to be visualized in order to communicate the model to the top management. Linear relationship is represented through a linear line or a linear equation. Number of kms driven is inversely related to the value of the car or the oldness or newness of the car is directly related to value of the car. The parameters that you identified in the model building process is represented through an equation and this is how visually it will look like.
Stage 7: Model deployment
Thereafter after seeing the robustness of the results you decide to deploy the model. The model deployment of cars24 is in real time. Whenever a user enters the details he gets the value of the car. At the backend the linear regression machine learning algorithm after inputting the value actually gives you the output of the value of the resale car.