

Step by step approach to analyze data to publish research papers in Top journals
- Model – The first step in analyzing the data is to look at the hypothesized model.
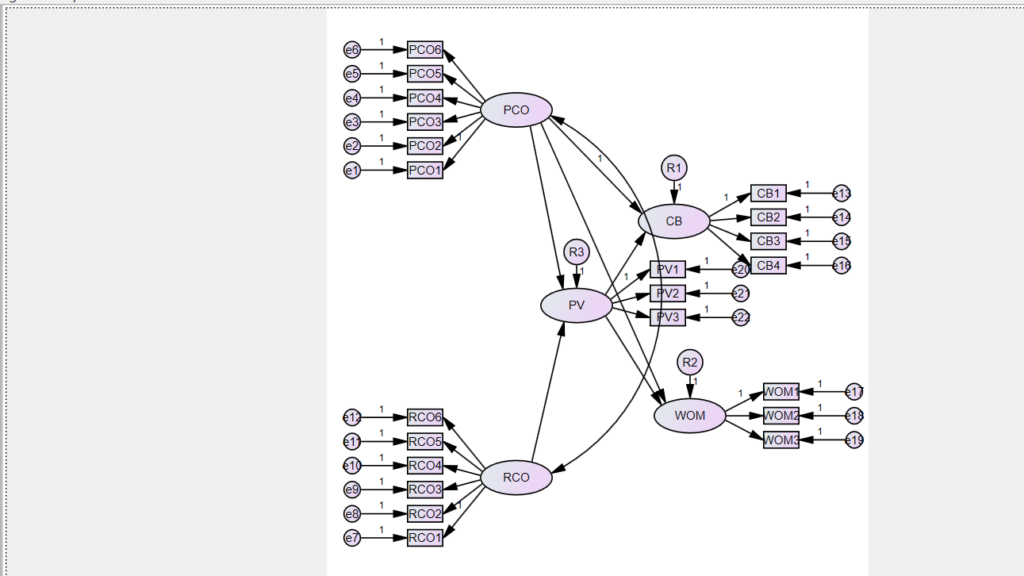
Variables in the model are as given below
PCO – Proactive customer orientation
RCO – Responsive customer orientation
PV – Perceived value
CB – Cross buying
WOM – Word of mouth
- Discuss the hypotheses – directionality of the hypothesis
- Discuss the constructs – operational definition of the constructs
- Discuss how the constructs were measured – scale items used to measure the construct
- Design of the questionnaire – Probably show a sample questionnaire
- Show the data and relate it back to the questionnaire and the scale items. Do the coding of the scale items if required and store it in excel sheet.
- Pre-requisite for understanding the analysis – Descriptive statistics, Instrument reliability and validity, correlation, factor analysis – Exploratory and confirmatory, regression.
-
- Let us start our analysis
- The first is to do reliability analysis – why this is important – entire set of variables and then construct wise. Look at the Cronbach alpha numbers
- Exploratory factor analysis (If you are developing scale – confirmatory factor analysis (if you are using established scales)
- This information is required because you need to also carry validity assessment i.e. convergent validity and discriminant validity
- CFA AMOS – or measurement model in IBM AMOS. This will give factory loading. From factory loading, you can calculate the scale composite reliability, Average variance extracted (AVE)
- Convergent validity (Factor loading, AVE, Scale composite reliability calculation), Discriminant validity (Correlation, AVE, Fornell Larcker ratio)
- Infer the discriminant validity and convergent validity – Generate the tables convergent and discriminant validity tables.
- Structural model testing – Model fit indices and the threshold, important indices, Hypotheses testing. A single-headed arrow is used to represent a hypothesized structural relationship between one construct and another.
- Why residual is to be added in structural model? Ans –
- Output analysis of structural equation modelling
- Chi-Square –
- Non-significance of Chi-square value implies that there is no difference between the assumed covariance matrix and the covariance matrix of the data. This would result in ideal model fit indices.
- If the Chi-square value is significant then we need check for model fit indices. There are various thresholds of the model fit indices
- Modification index was used to identify error covariance between items of within construct and between constructs. Modification indices are used to delete the items in the measurement model
- Then look at the significance level of different hypothesis in the model.
Further readings
What is p-value?
Why SEM is preferable to regression?